How to use Popometer.io
Part I - Your new tool.
Getting started
This guide is a bit more in depth. If you look for a quick guide go here!
After you have downloaded, unzipped and connected the client, just let it run in the background whenever you want to record laps. We suggest not to record all laps, because it will clutter your storage, but only deliberately record when you want to compare data.
Once you have completed your run click on "Laps" in the top menu. You can now filter and sort your laps to find the desired laps you want to look at. Just click on it! (In order to test the whole process we suggest just doing a lap with the M4 GT3 on Snetterton, as this Data Pack is free. Just click download and it will be added to your owned packages.)
For a reliable comparison we advise to drive in similar conditions as the data pack. Air temperature in particular will affect the downforce and engine power (colder = better) and distort the data.
Once you own a pack and have driven a lap you can start the comparison process from either your own laps list by clicking on a lap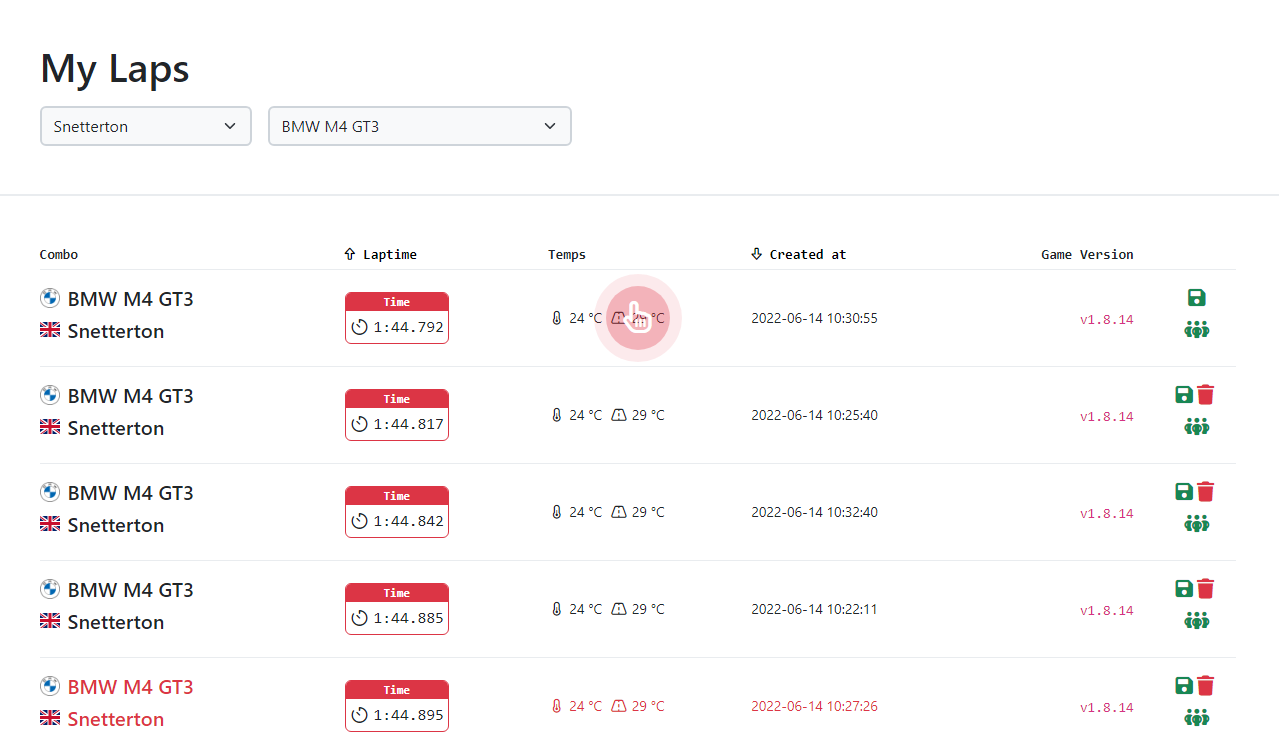
or by opening a lap from the owned data pack - just by clicking on one of the laps within a package.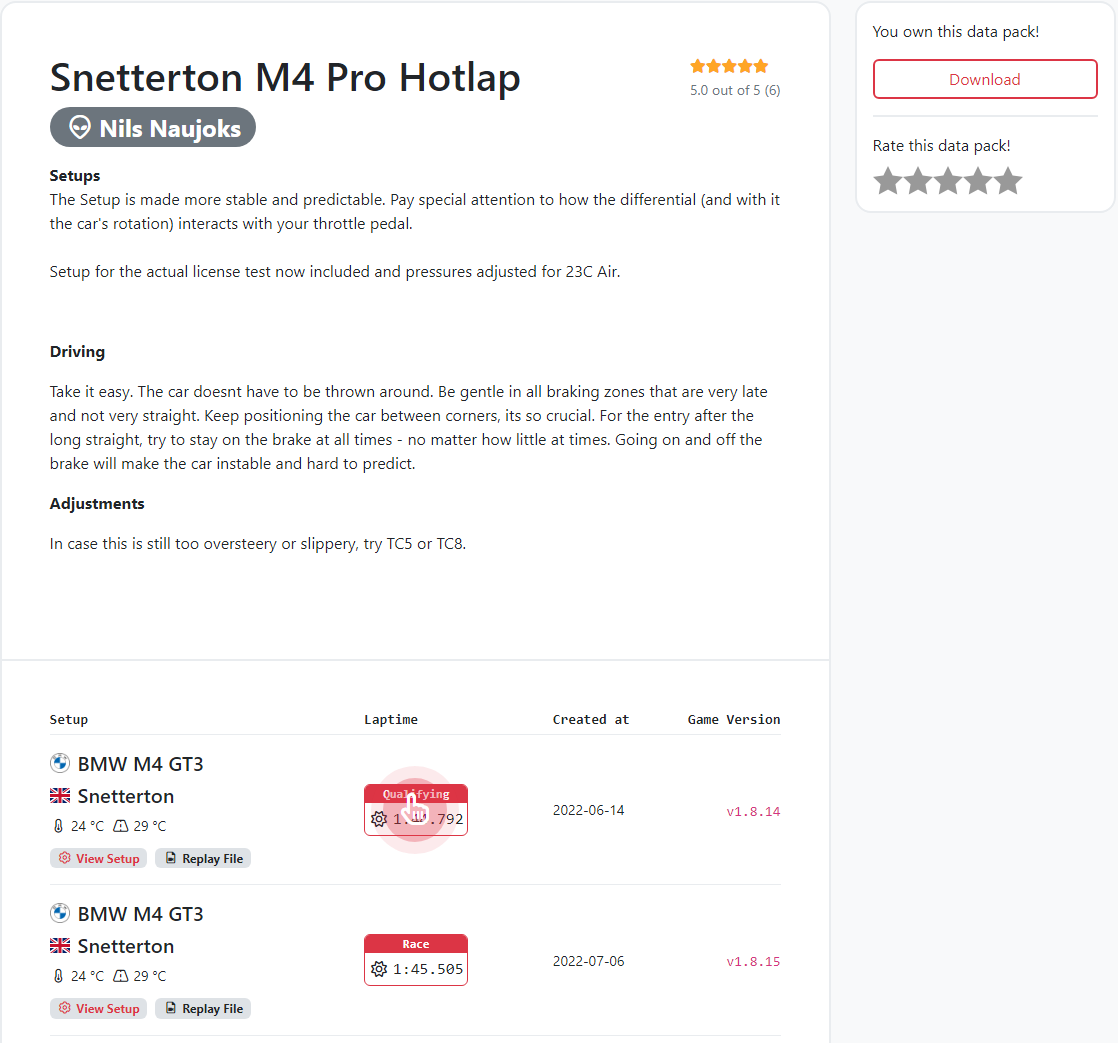
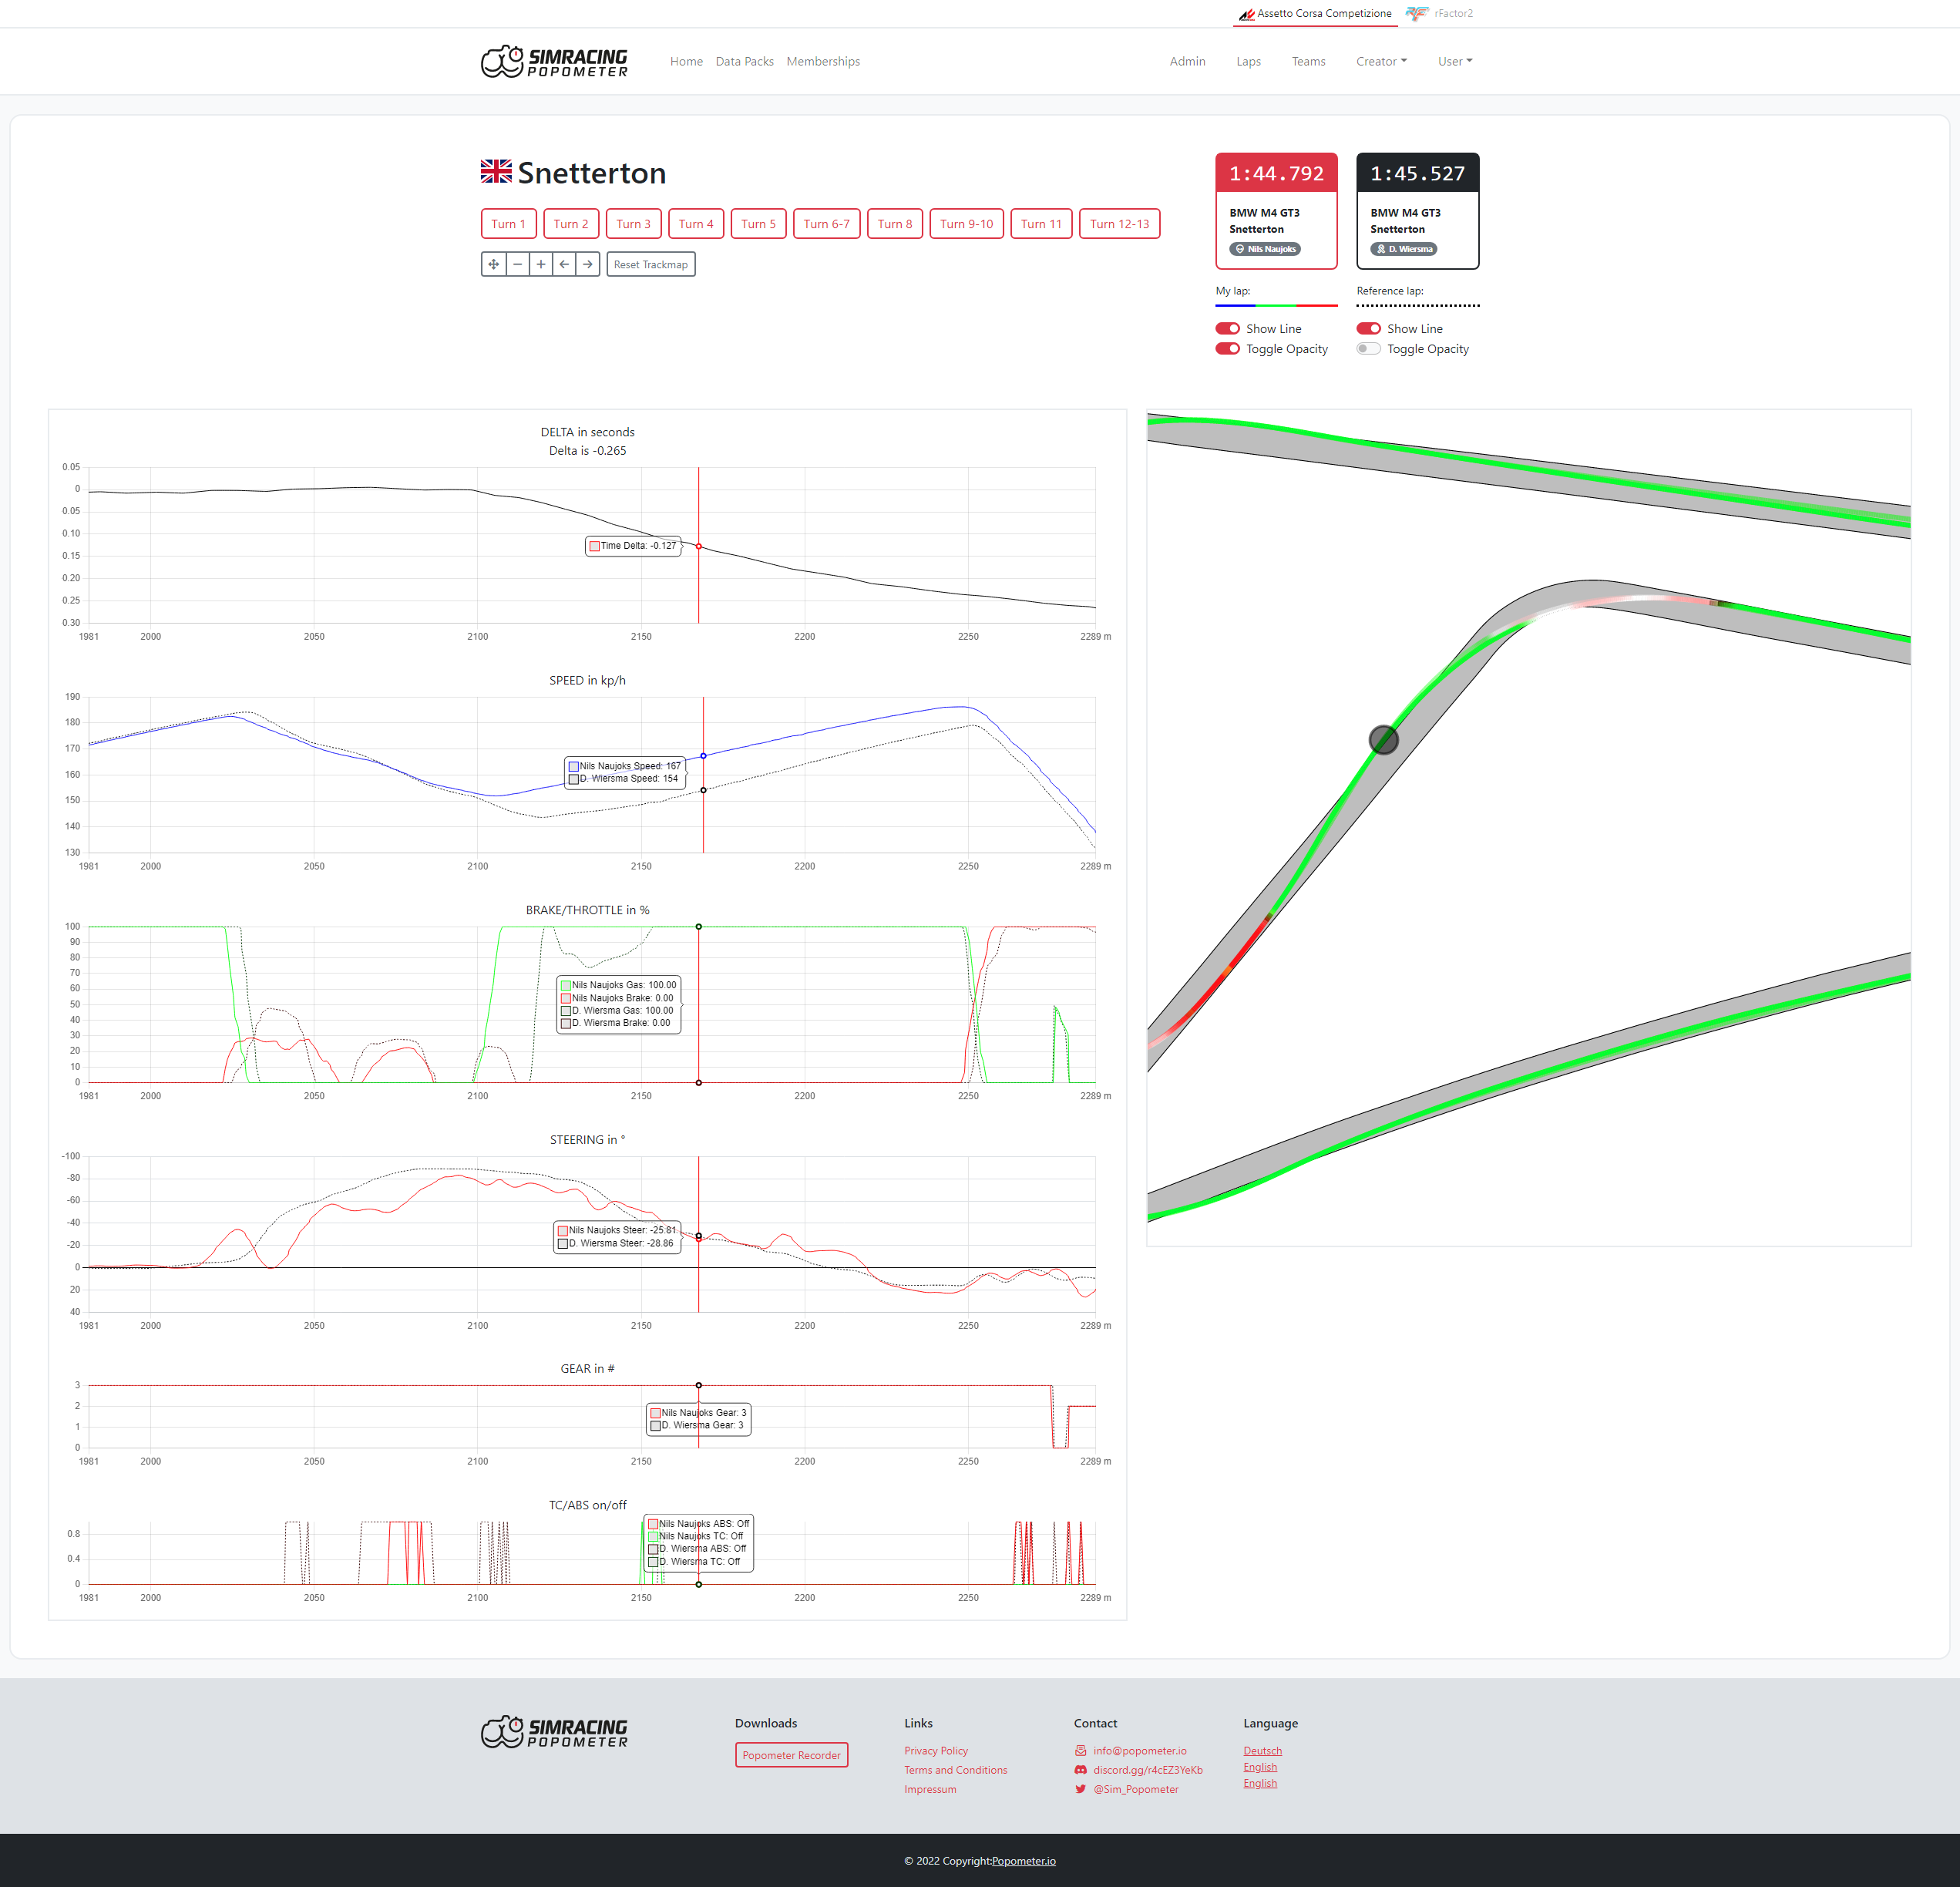
Overview - what do we see?
Controls
- On the top you have a quick selection for the various parts or corners on the track, which will zoom in automatically into pre-selected areas of the data.
- Below in grey, there are a few control buttons to navigate in the data: Zoom, move, reset.
- The red box on the right shows the first chosen lap, while
- the black box and the "compare" button allows you now to select a comparison lap (wait for now!).
Charts
- various charts: Speed, pedals, steering, gears, electronics interference
- you can zoom in by marking a section in each chart
- the bottom (x) axis shows the position on track in meters
- the vertical (y) axis shows the reading of telemetry at each point on the track
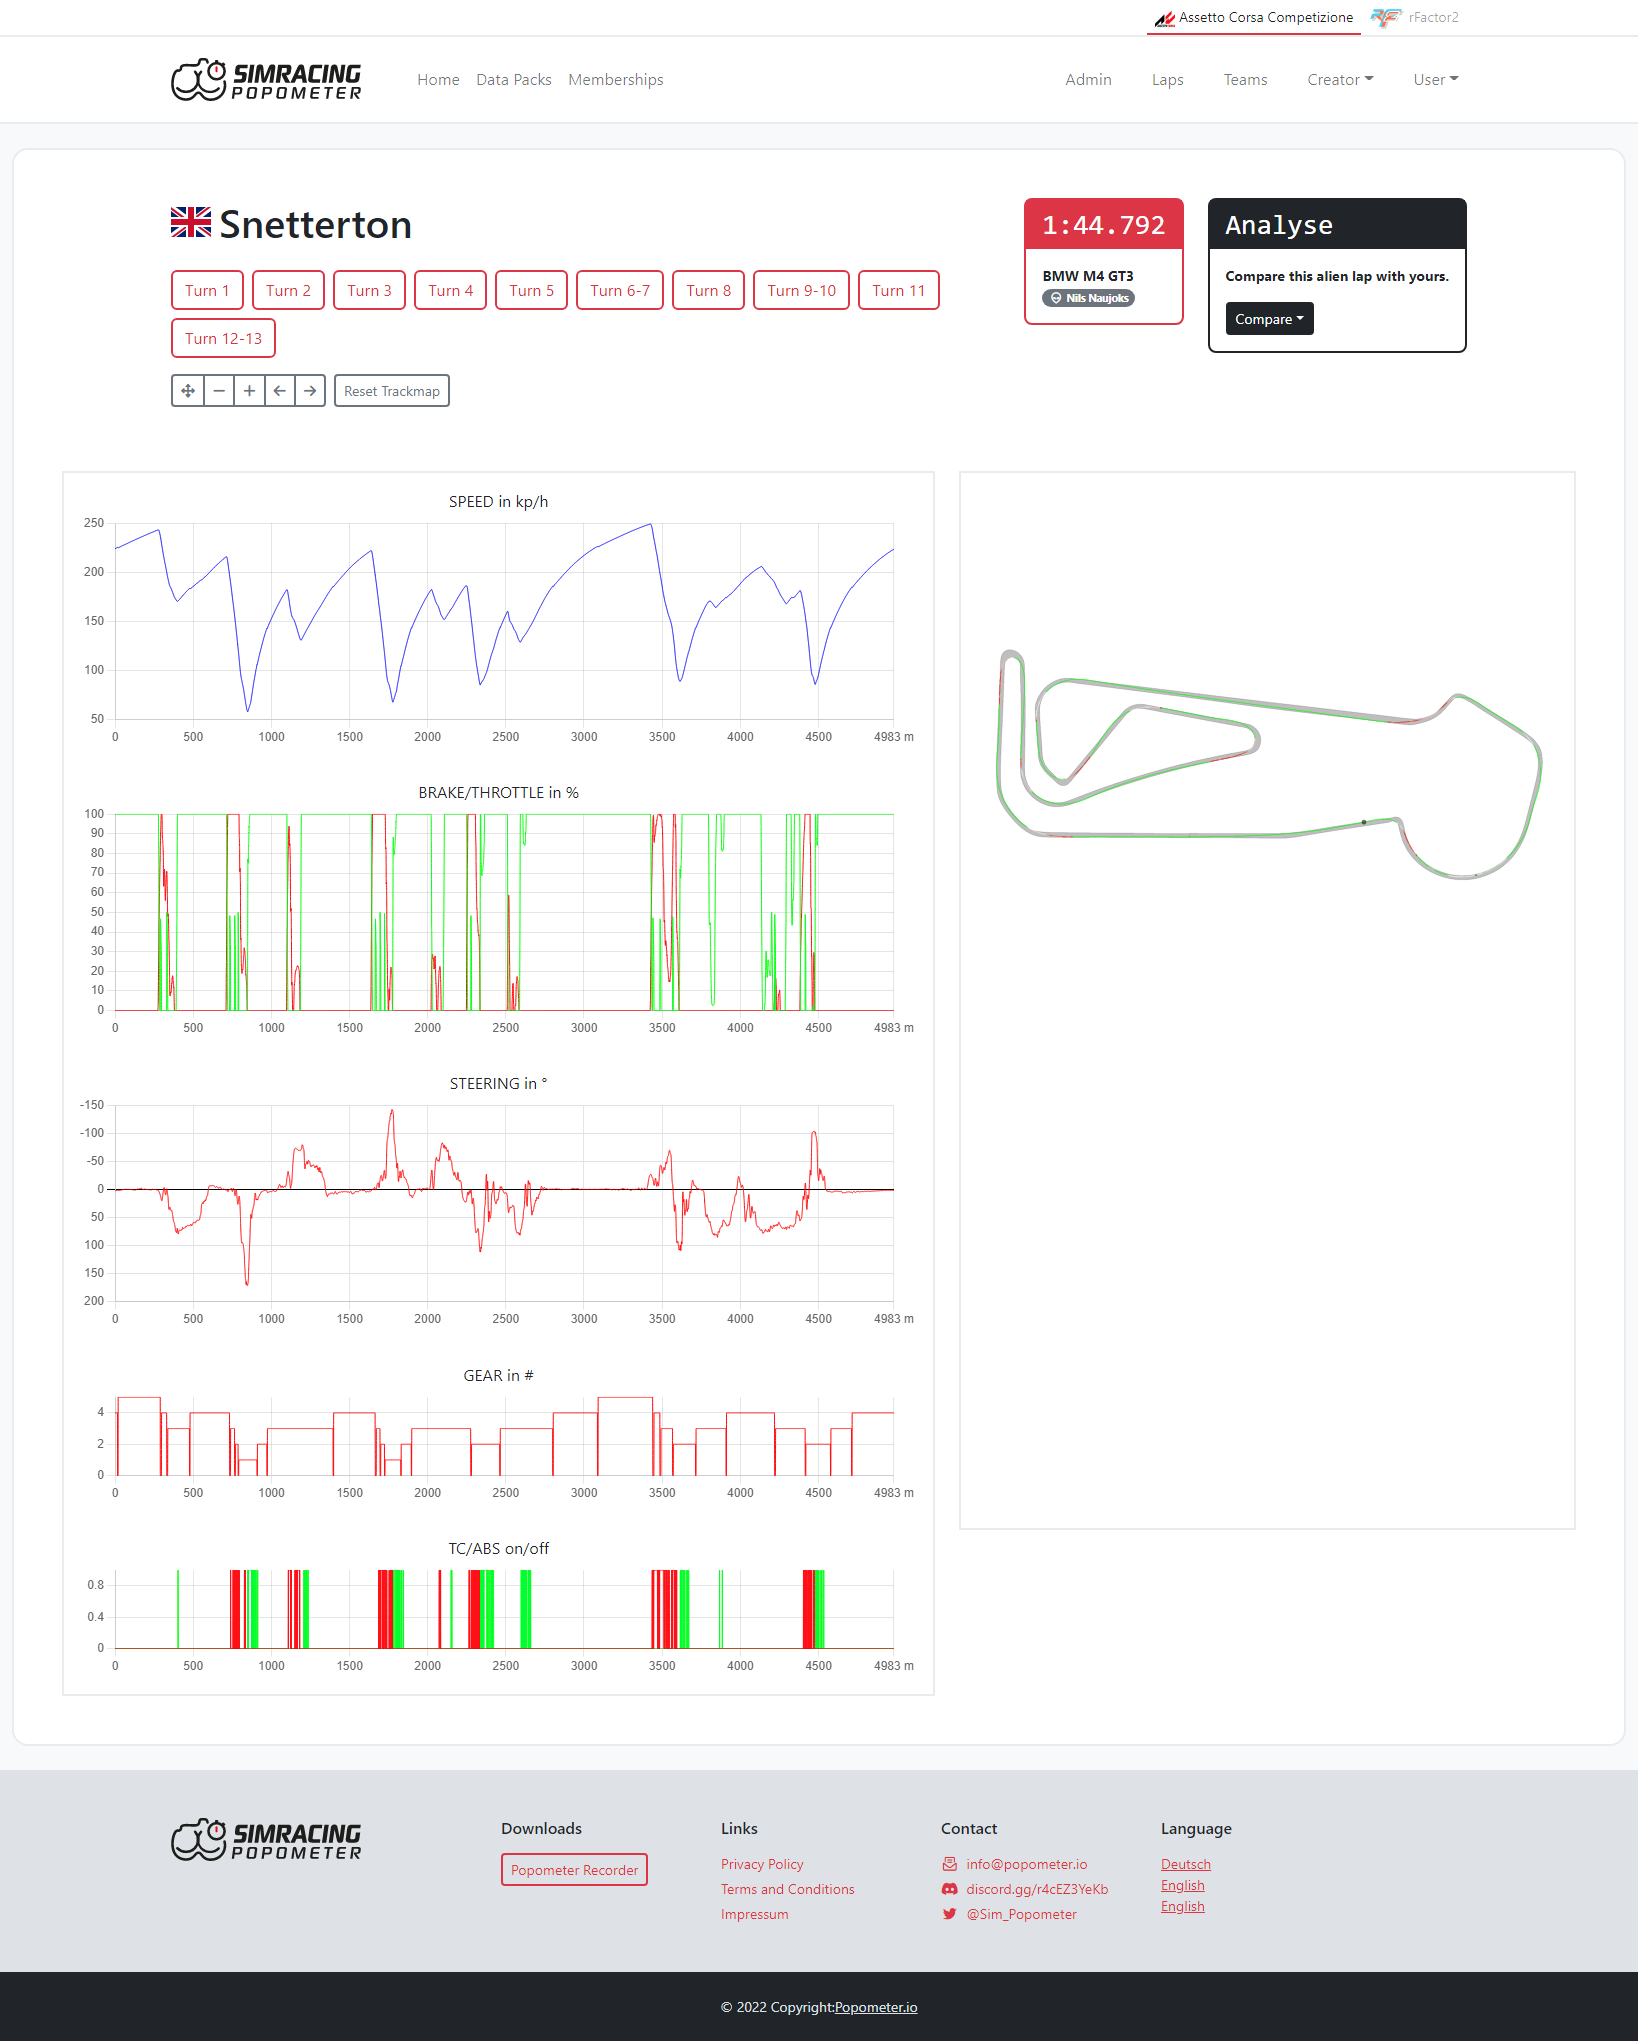
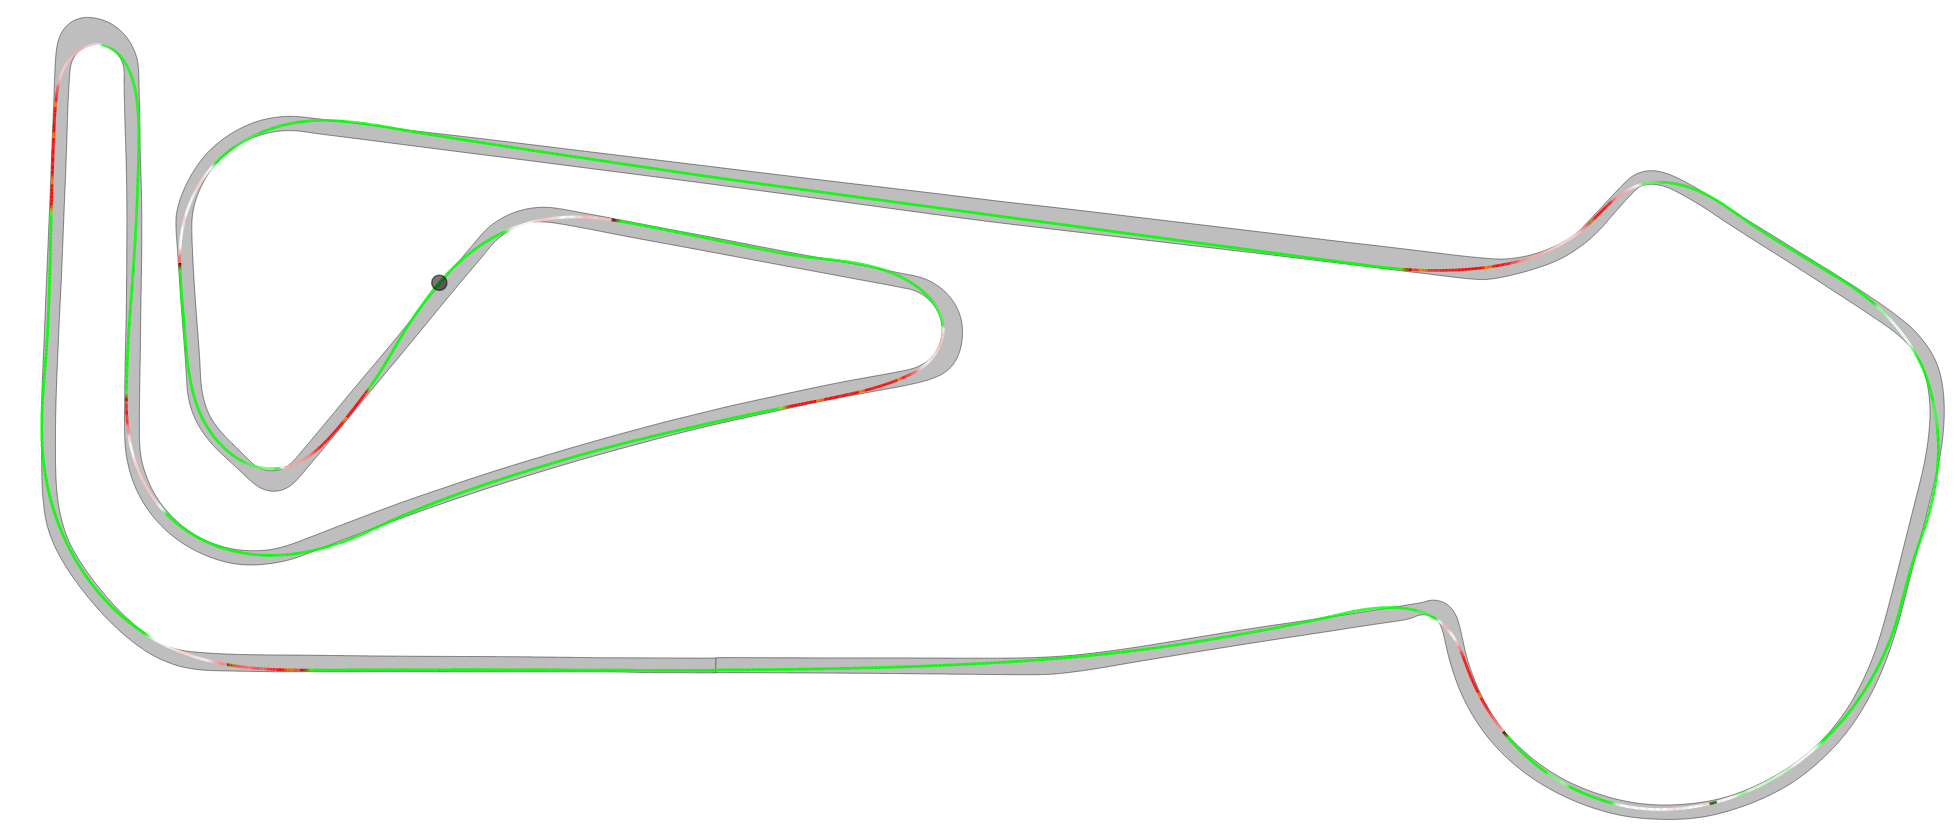
Map
- zoom in (a lot!) and out of the map with the scroll wheel, move with left click, reset button in the grey navigation
- the map marks the edges of the track with black lines which represent the white lines in the game. It's pretty accurate.
- the colored line shows exactly where the car was driving. The line is as wide as the car measured from the center points between the front tires
- this means the track limits the game enforces can be seen here, too, as its sometimes not the white line. Copy this from the professionals.
- the color of the driving line by default represents
- brake (red) and
- throttle (green) inputs
- yellow or black parts in the data indicate overlap of both pedals
- Yellow often under full braking with the automatic throttle blips by the car
- Black often when your feet can't quite decide what they want :)
- white means no pedal is pressed
Comparison and orientation
First select a comparison lap. If you started the process with a lap from a purchased package it will list your laps in the drop down. If you started with your own laps it will list pro laps of data packs (owned and unowned) - or laps from within your team if you have the subscription.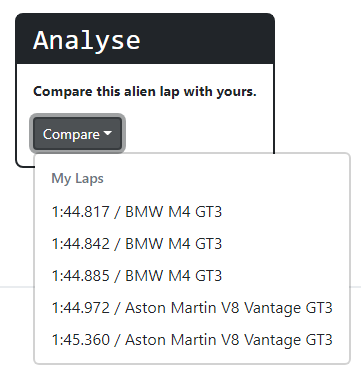
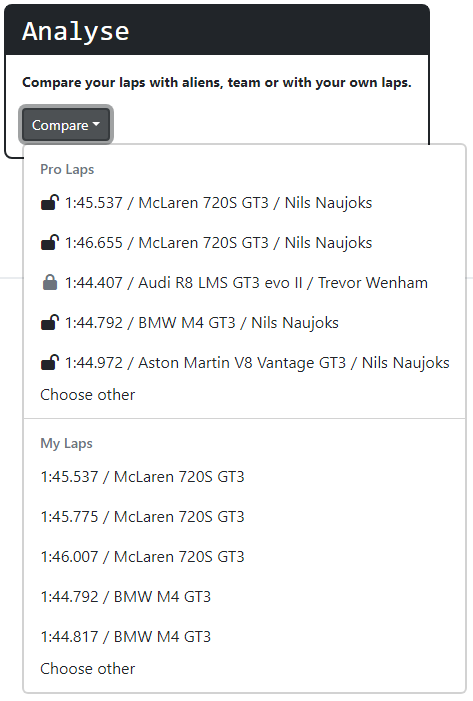
If the desired lap is not listed for whatever reason, hit the "choose other" button in the respective section to be taken to a bigger list.
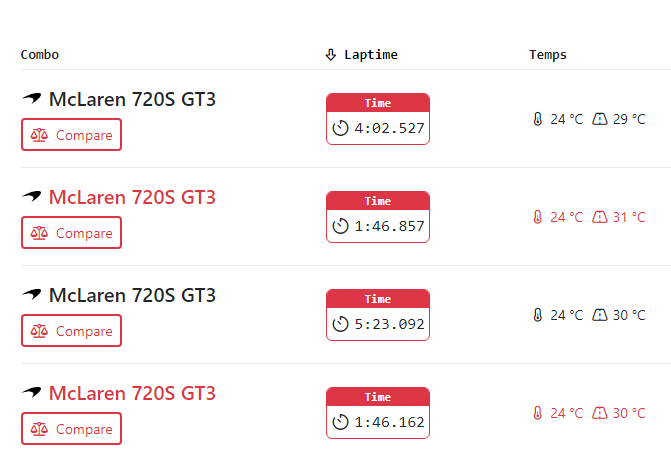
Here you have to click on the compare button on the left, not on the entire row, which would restart the process with this lap(!).
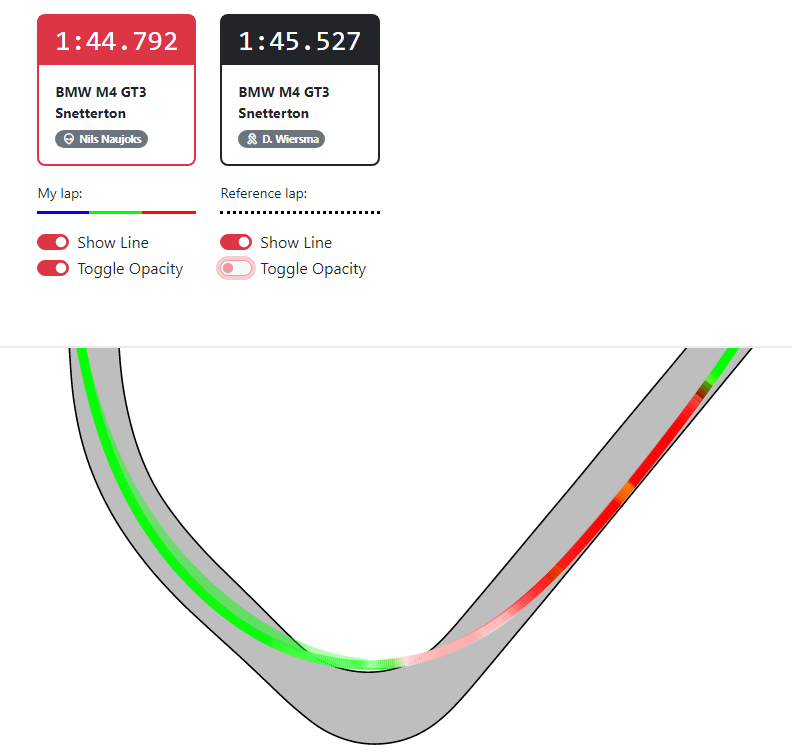
After some loading, now you will have both laps in the comparison view! Also now there are lines for both laps/drivers in the charts and track map. To distinguish the lines on the track map use the toggles above to make one line transparent or remove it entirely. In the charts the data of the first selected lap will remain in color while the comparison lap is shown in black dotted lines. Hover over the data to bring up a small popup that displays the values.
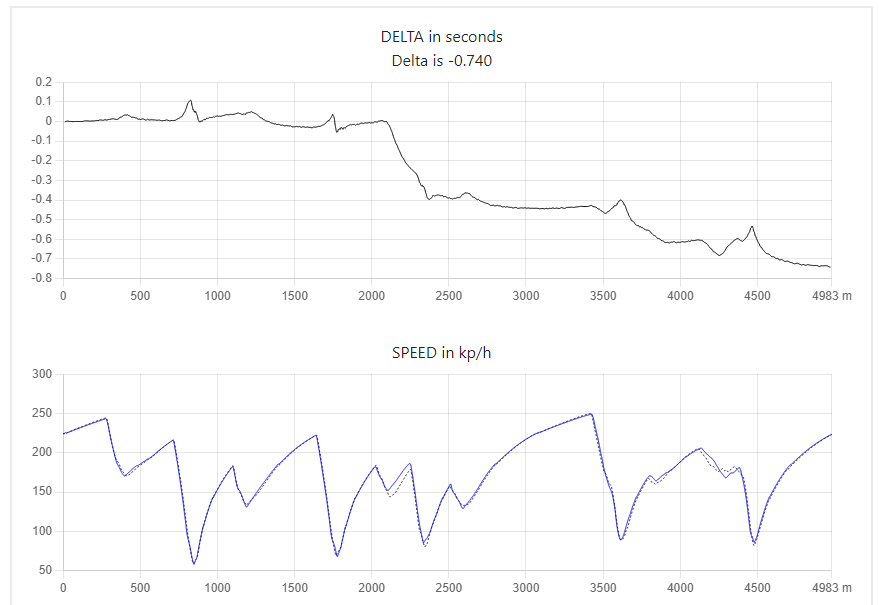
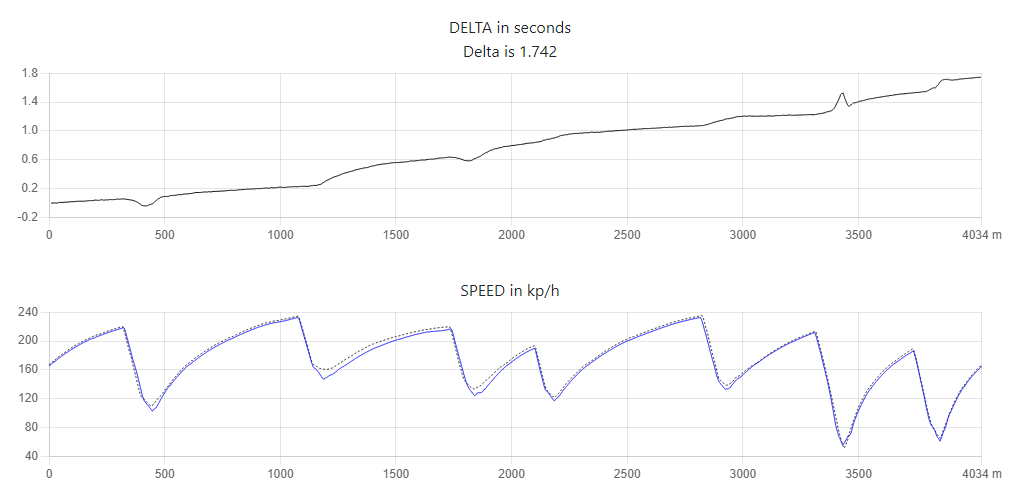
With that a new Delta Chart is now visible, that shows you where time is lost or gained.
- In this example a total of 0.74 seconds is lost over the lap
- if you zoom into sections the delta for that specific area will be shown on top instead
- for easy reading look at the speed chart. Every low end point usually marks a corner and every high end point marks the end of a straight or start of a braking zone. This way you can quickly count the corners. Hovering over the data will also highlight the position on the track map. And vice versa if you hover over the track map, the cursor in the data will be in sync.
- roughly in the middle of the track at 2100 meters there is a big drop in the delta. This will be accompanied by a big gap in speed between both laps in that corner.
Part II - Analysis (or: How the f*** do I get faster!?)
Finding differences
In the above case there was a major time loss in one particular corner. In this case you are very lucky, as there is a lot to improve with just a tiny change most likely.
General
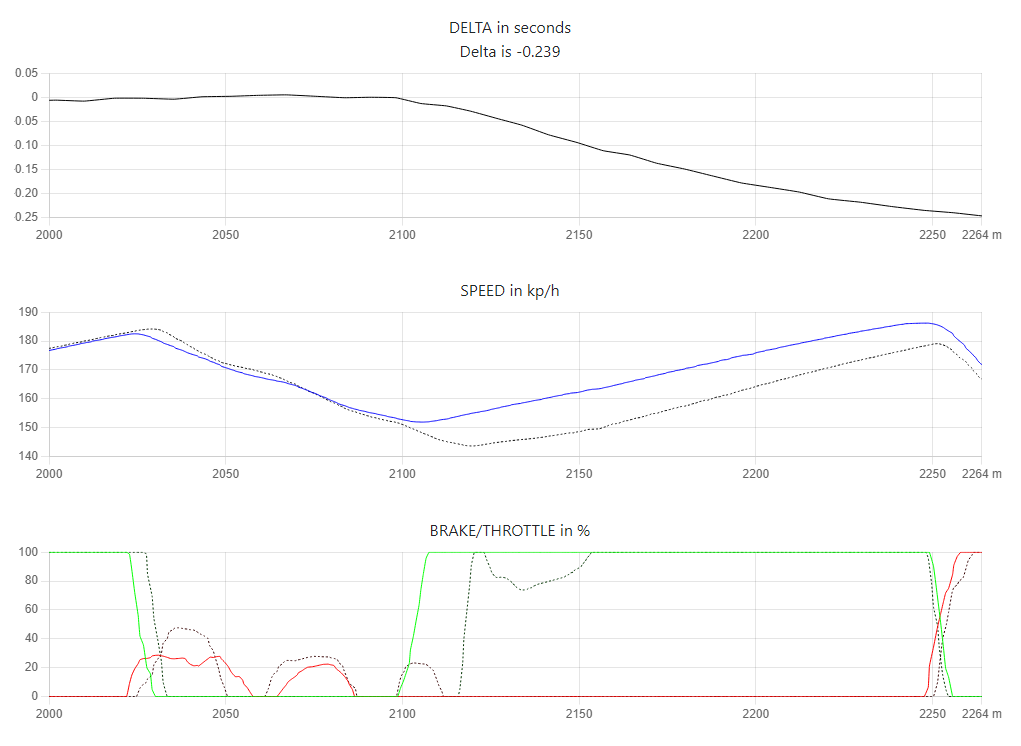
Let's zoom in!
- For analysis always watch a complete section. A complete section starts with the braking point and ends with the next braking point. The reason is that time loss will typically occur much longer than just the corner where the mistake took place. So we are looking from the start of the issue until the end of its impact.
- In this case the faster lap is with the colored lines, while the slower lap is with the dotted black lines
- zoomed in we can see the first surprise: The time loss is occuring mostly AFTER the corner and ALWAYS where the speed difference is big (logically). You can also see the delta now shows 0.265 seconds lost in that area.
Standard Checks
Generally comparing inputs we are looking for:
Charts
- When/where
- how quickly
- how much
- how long ... an input occurs or disappears
- or what is the sequence/synchronicity of inputs
Map
- Where is the car placed
- where is the apex (closest point to the inside of a corner) - is it earlier? later? once or twice?
- where is the slowest point in the corner? (This is usually before throttle is applied, yet can extend into areas where only little throttle is applied)
- where are slowest point and apex(es) in relation to one another?
- how much track is used
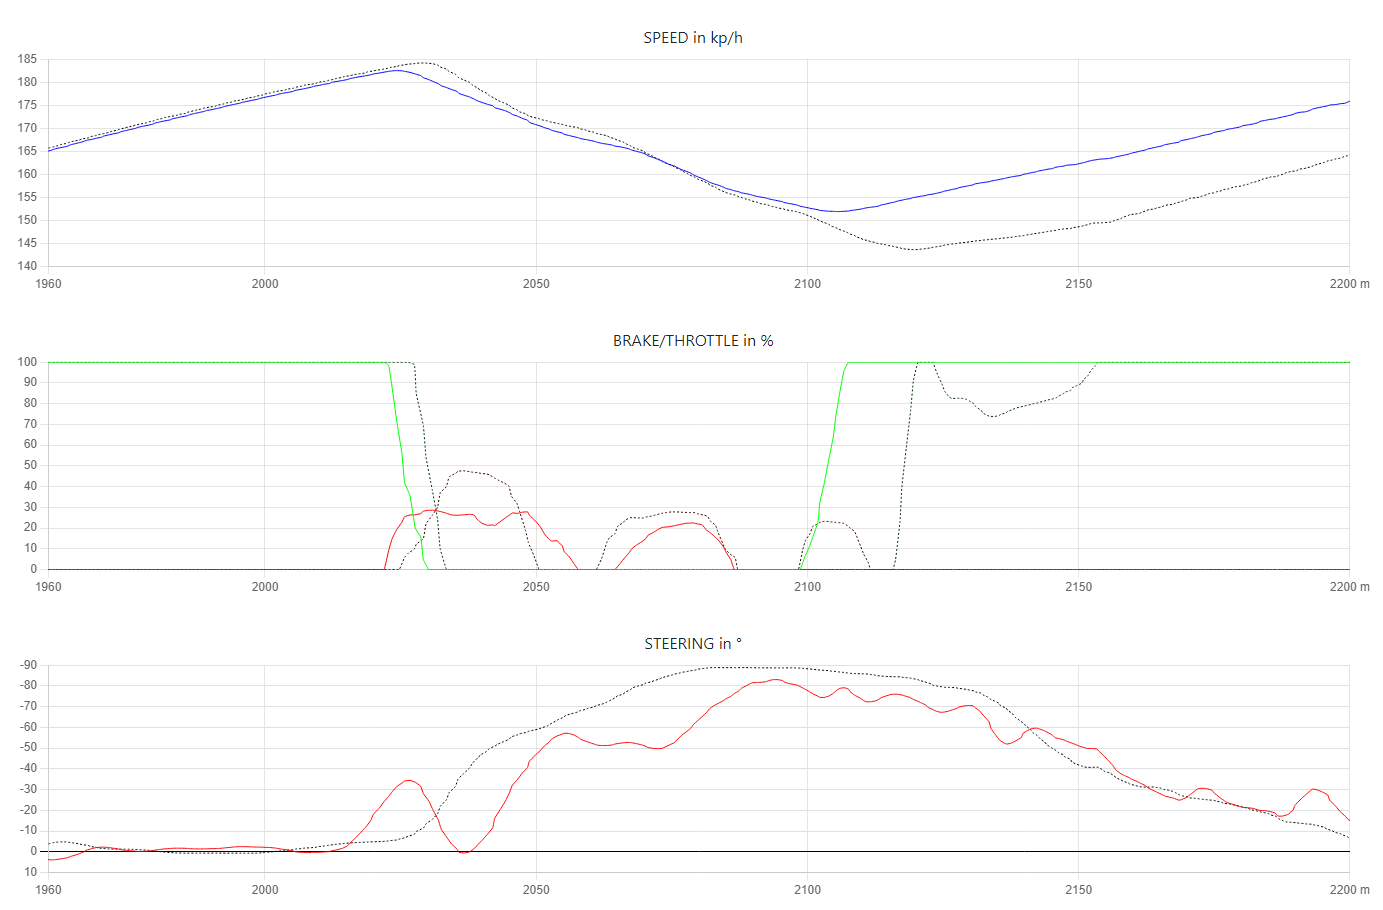
Analysing pedal inputs
- When does each driver go off throttle and onto the brake?
- dotted line later, roughly 2-3 meters resulting in higher initial speed in the braking zone
- how quickly does each driver go out of the throttle and into the brake (how steep is the line?)
- similarly quick, no relevant difference
- how much is the throttle released, how much brake is applied?
- both no throttle
- dotted line brakes more, 50% instead of 30%
- How long is the brake pressed?
- dotted line shorter
- How quickly is the brake released?
- dotted line quicker
Analysing steering
- When do both drivers turn in?
- colored line earlier and slightly before hitting the brake
- dotted line later and in sync with the brake
- How fast do both drivers turn in?
- similarly quick, but colored line opens up again (likely counter steer resulting from synced brake and turn in, creating a lose rear end aka. rotation)
- dotted line keeps increasing smoothly, colored line increases in larger steps
- How much do both drivers steer?
- dotted line steers more for most of the corner, however the maximum is similar
- When is steering decreased?
- similar
- How fast is steering decreased?
- similar
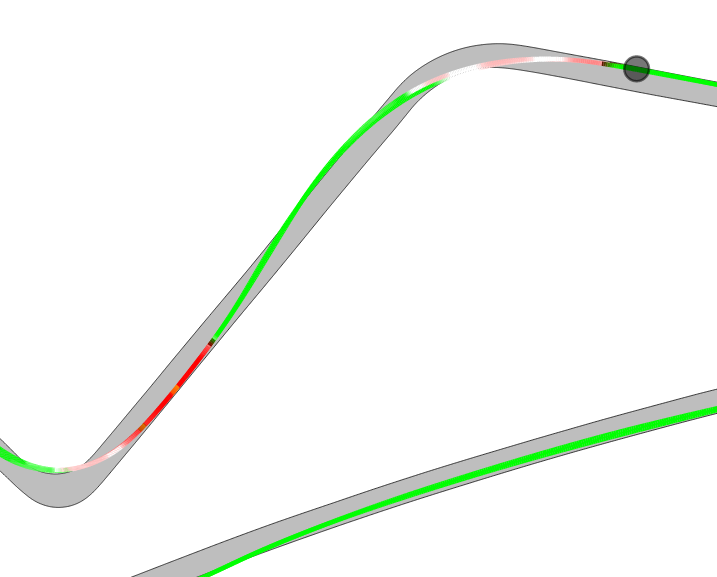
Analysing the map
(here: transparent = dotted line, slower lap || opague = colored line, faster lap)
- dotted lap misses the apex slightly
- this could be from turning in too late,
- braking too late and harsh and carrying too much initial speed with a too aggressive weight transfer onto the fronts (also indicated by ABS being triggered, whereas colored line has no ABS interference)
- not setting the rear lose with synced brake and steering
- dotted line goes wide
- has to slow down (third brake input to keep it on track way past the apex)
- throttle application much later
- slowest point in the corner a good 10 meters later for dotted line
Result
- time loss starts after the apex as dotted line still needs to decrease speed in order to make the corner, taking longer to pick up the throttle and losing the majority of time on the short straight between the corners.
Takeaway
- turn in slightly earlier and in sync with a smaller brake input to set the rear slightly loose (this would be the advanced technique). however it certainly is enough here to fix the exit, by making the apex in the first place, which can be achieved simply by braking and steering slightly earlier
- this will allow to keep the car tighter and accelerate earlier, reducing the time loss on exit and on the straight after
- shifting the focus towards leaving the corner, not entering it
Patterns
The above example is a very typical pattern. There is a general misconception of everyone starting with racing, that corners are the main challenge. This isn't wrong, but the misconception is that in the corner is also the place where time is gained. And that is only partly true. Of course you can lose time in the corner itself, but it's much more likely you will lose tiem in the early exit phase of the corner and that will cost you for the rest of the straight as well. Here's a general advice: Think how much time you spend on a straight versus how much time you spend in a corner. Exactly. On almost every track the majority of time is spent on straights. This is where you need to be fast.
For most people it will be more likely there's one of the following scenarios (or combinations of them):
- Several big time losses and a few areas with smaller time losses
- Time losses across the board
- Time losses in specific corner types (e.g. fast or slow or long or short corners)
- Time losses into or out of (rarely both) every corner
Several big time losses
The above example is typical for this. An individual mistake and issue in a particular corner, where the driver can't quite wrap his head around. This isn't really a pattern in the data. It's rather a pattern for the driver itself, that there are sometimes individual places where he/she struggles. This is bad because it's hard to find a single solution, on the other hand its good because a lot of things already work, and there is not that much to work on.
Time losses across the board
This likely means there are several issues, for example patterns paired with or leading to individual errors. It indicates something more fundamental. A general lack of perceiving where the limit is. Here you really want to go corner by corner and work out the differences as in the example above.
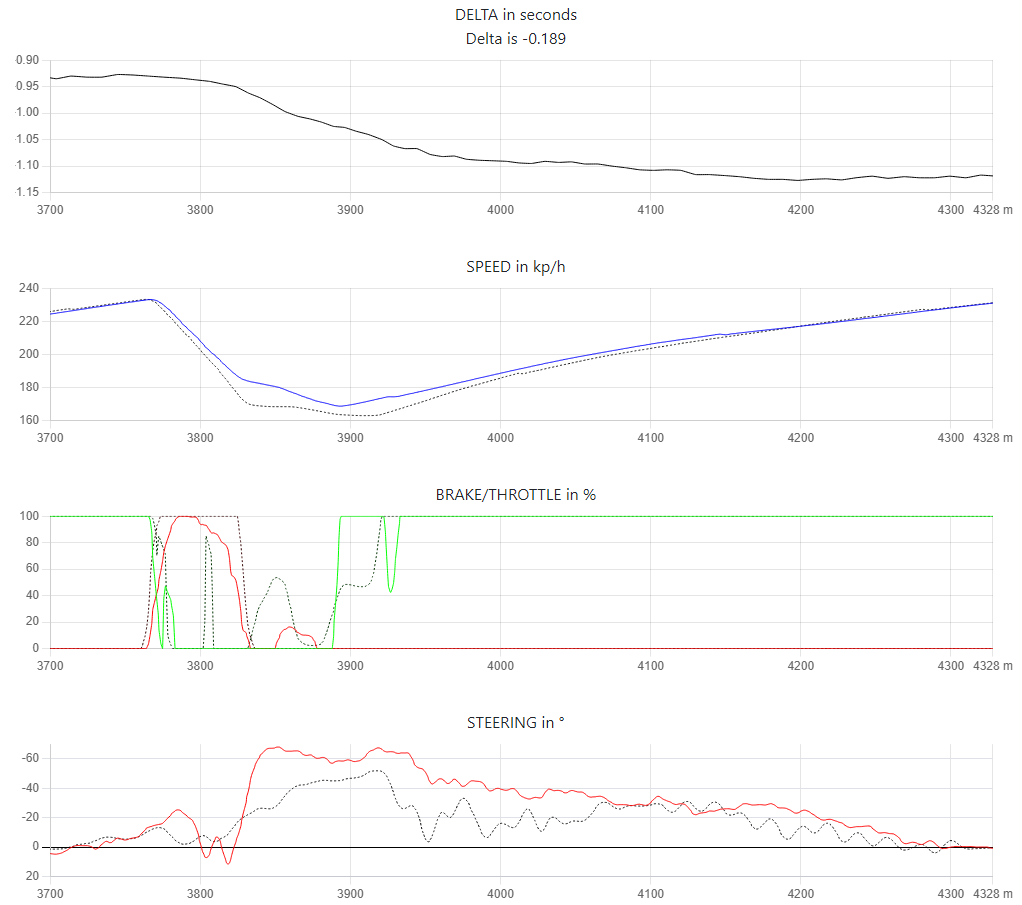
Time losses in specific corner types
This is already quicker to analyse. The below image shows Pouhon, the fast double left on Spa - a high speed corner, with tricky braking. If you find yourself having issues in high speed corners in general, it's likely your brain hasn't figured out that a car in high downforce situations behaves differently than in slow speed situations where downforce plays next to no role. Typicall pitch under braking is confusing, as the car suddenly changes its entire balance and become unstable. Typical coping machanisms are to brake much harder, to force the ABS to engage and make the car lose all the speed before the corner, but not really brake into it, to avoid the situation where the car is turning while pitching forward in its most vulnerable state. Pros might work around this by being more comfortable with trailing the brake and steering much more carefully - or they force understeer by turning a little too much very quickly to stabilize the car. Both patterns are visible here. Oversteer on entry with trail braking and forcing understeer once the braking is finished.
Understanding that the car behaves fundamentally different in high downforce situations is crucial here to start working on your inputs.
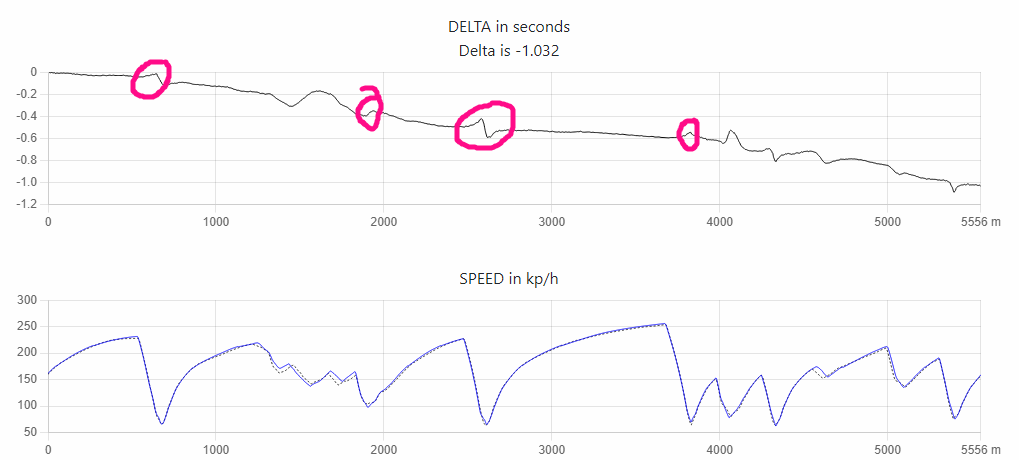
Time losses into or out of corners
This is one of the most common patterns. The marked sections show slight time gains as the braking zone starts, followed by time losses in the middle of the corner and/or exit. We don't even need the pedal inputs here as they would simply confirm one thing: The driver tries to brake later than late, focussing all his energy on being the hero of each corner. You can hear the driver screaming internally, trying to force the car around the track. The issue here is the misconception that corners yield the most laptime, while the straights afterwards are sacrificed for that heroic idea. Braking slightly earlier and focussing on better exits will most likely shave off a lot of lap time here.
More rarely this pattern can occur the other way around, where entries are sacrificed too much for great exists, but the straights never fully give back the time lost on very wide entries.
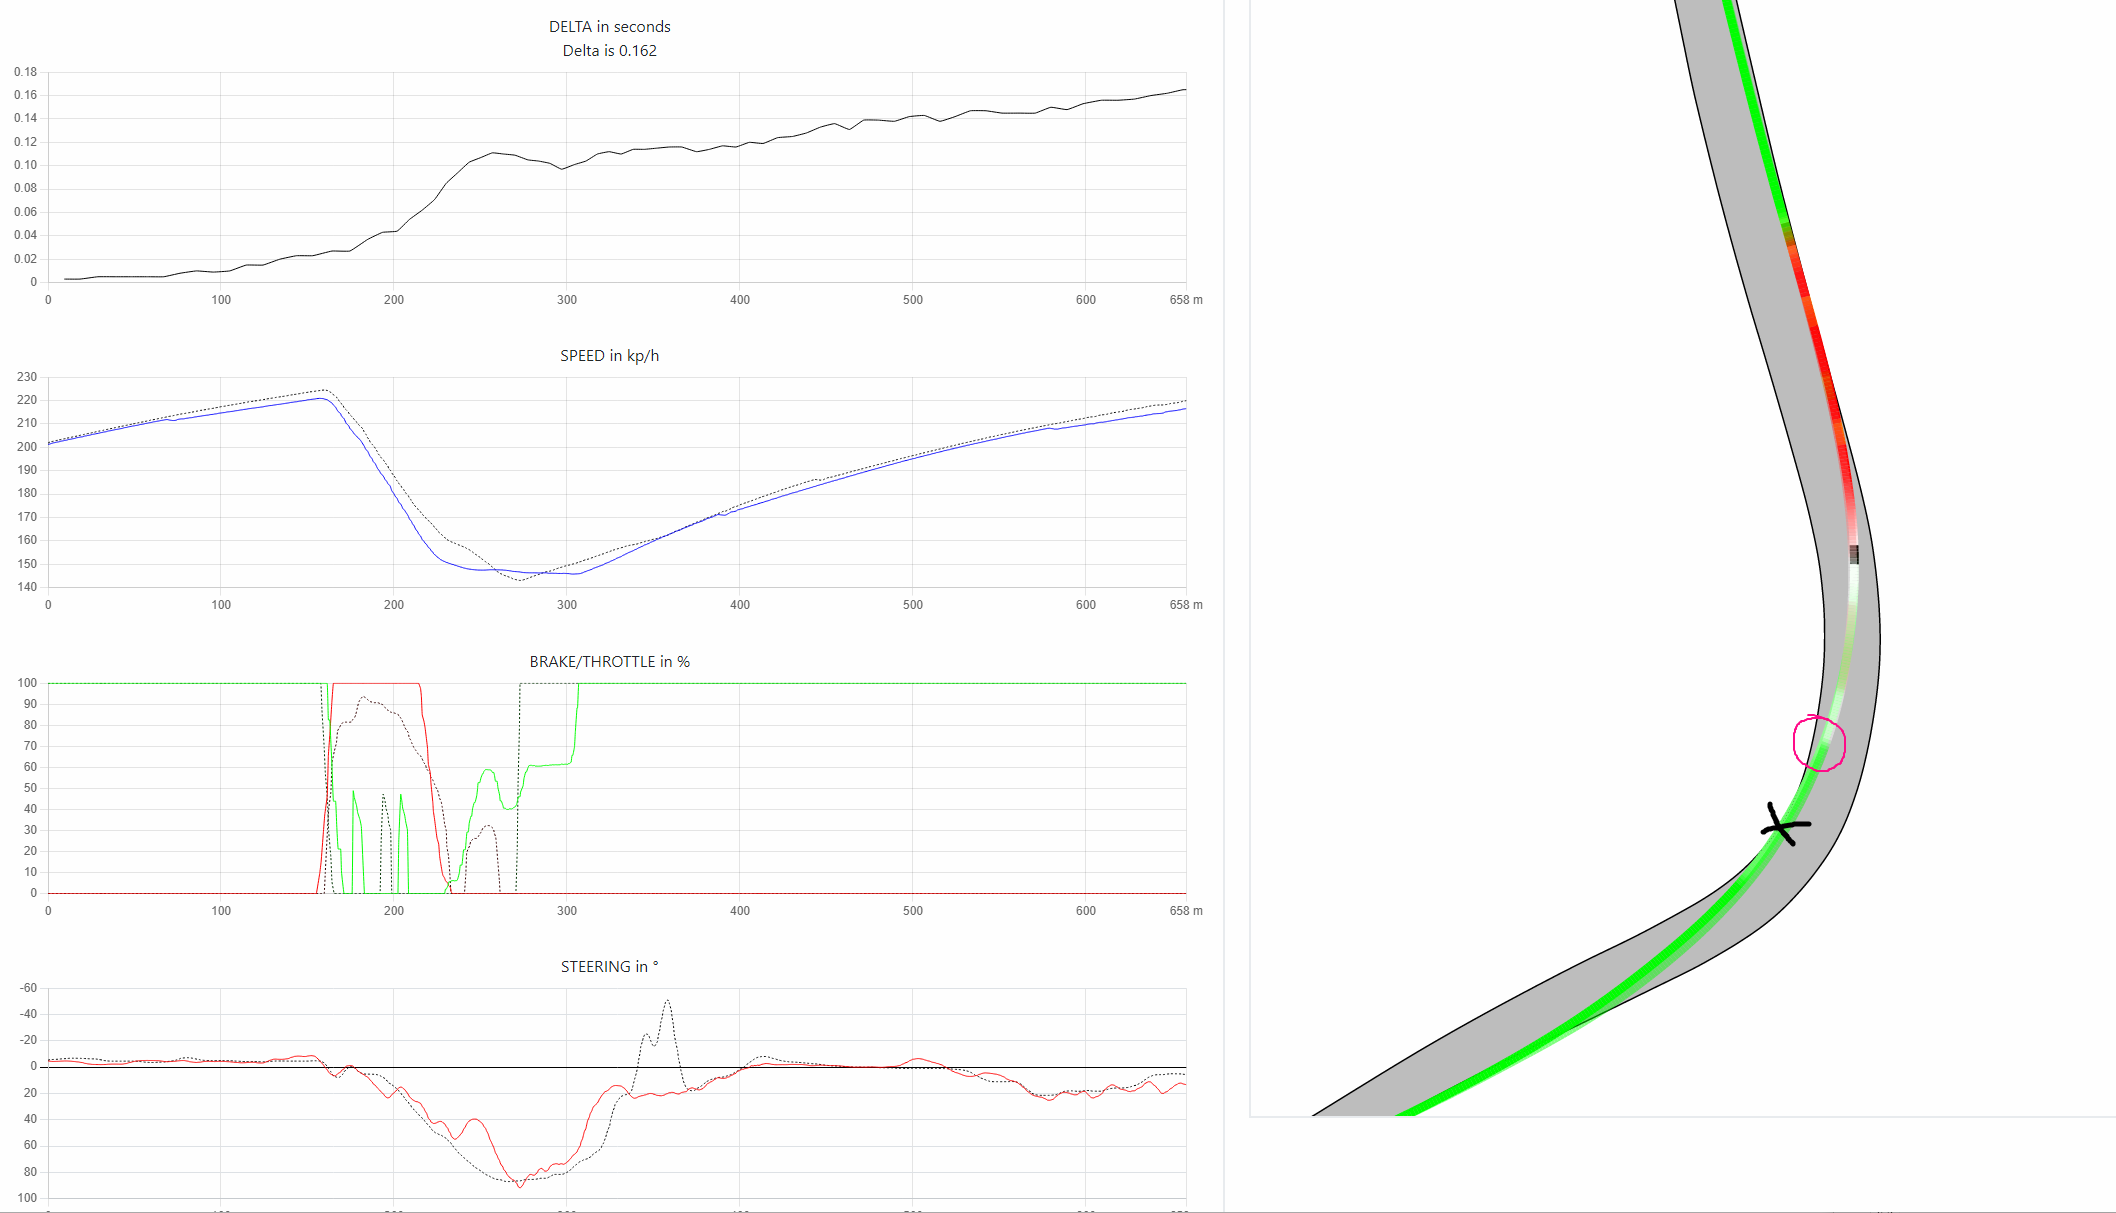
Overslowing
The below is a VERY COMMON pattern. This is Oulton Park Turn 1. I have marked the slowest point in the corner of the Pro with the pink circle. And I have marked the apex (tightest point in the corner) with the black cross.
The pink circle corresponds to the lowest point in the speed trace of the dotted line, where it undercuts the blue line of the user laps. The blue line reaches its slowest speed very early and then more or less stays there for a while. If you want to take away just one advice: You either want the car to slow down, or to accelerate. It's very rare stable speed for a prolongued period of time will be the correct way through any corner. That means either braking (and coasting) or accelerating. Do not use the throttle when you do not want to actually accelerate (unless you are driving aggressive Porsche oder Honda setups).
So how does the difference in the speed trace emerge?
While the braking point is similar you can see that the pro driver never really saturates the brake signal. He always leaves some room. Think of the tire having a limited amount of grip. If you use it all for braking, there is nothing left to use for steering. Here the pro wants to have something left for steering at all times, thats why there needs to be room on the brake, and grip left to steer.
The user in this case brakes very hard and keeps braking very hard while starting to increase the steering. The problem is: The car will very likely not respond to the steering, because all grip is already used by the brakes. This would make every driver nervous: Steering but going straight is a very unfomfortable situation. The issue now is that your brain will tell you: You are too fast, while the issue is "you are braking too much". With that assessment of the situation the brain has no option than to keep decreasing speed drastically. Only once the harsh braking stops, the car will suddenly respond to the steering input.
However, the problems have just started. Now the car is very slow and if the driver used all the grip available, would likely cut the corner way too much. It's typical that drivers refuse to steer less (however it happens), so what happens next to not go too much to the inside is that the driver uses the throttle, to keep the speed high enough. However, you can see the car is not accelerating, it just cruises through the corner at stable speed. The next and final problem is that half-ish throttle will lock the differential, forcing both rear tires to spin at the same speed. This will lead to neverending understeer, again making the driver believe going too fast, which leads to more half throttle and an endless wait until the throttle is pinned down. Instead a sudden and aggressive throttle application will likely force the rear end around and not cause the understeer.
To sum it up, most problems are an aftermath of the initial mistake of braking too hard, not allowing any grip to be used for steering, leading to the impression of the car being too fast. Once the braking gets sorted out, and there's grip left to convert to cornering, everything after will fall into place.
To be continued
We hope the guide is helping you use Popometer. Whenever a question arises, feel free to head over to Discord and let us know.
Over time we'll keep adding analysis of further patterns here.